Behind the research headline
Semaglutide safety headlines: what does a severe-event percentage measure?
How measurement definitions and analysis choices shape the meaning of a semaglutide safety headline.
Published · 12 minute read
A safety percentage is an answer to a question, even when a headline leaves the question unstated. Someone has decided what qualifies as an event, which records belong in the analysis and how observations should contribute to the summary. Reading the number without those decisions can quietly replace a narrow finding with a much broader claim about a medicine. The scientific task is to recover the question before judging the answer.
This analysis develops a way to read a semaglutide safety headline through measurement, arithmetic and inference. The accompanying figure holds the selected study data and their context. The discussion asks what additional information would support a different conclusion: an event history, a joint classification, a different population comparison or a causal contrast. Those are concrete research requirements, rather than reasons to dismiss a result simply because it cannot answer every question.
Wide tables can scroll horizontally. Keyboard users can focus a table region and use the arrow keys to move across it.
Reading the evidence
- Classification
- A named category selects a dimension of experience; other dimensions need their own measurements.
Sources: [1]
- Arithmetic
- Reproducing an adjusted summary requires its weighting rule as well as the underlying counts.
Sources: [1]
- Observation
- The time a record qualifies for analysis belongs in the definition of the result.
Sources: [1]
- Aggregation
- A person-level flag loses chronology and recurrence unless those details are presented separately.
Sources: [1]
- Inference
- A claim about another population or another outcome needs assumptions beyond a selected percentage.
Sources: [1]
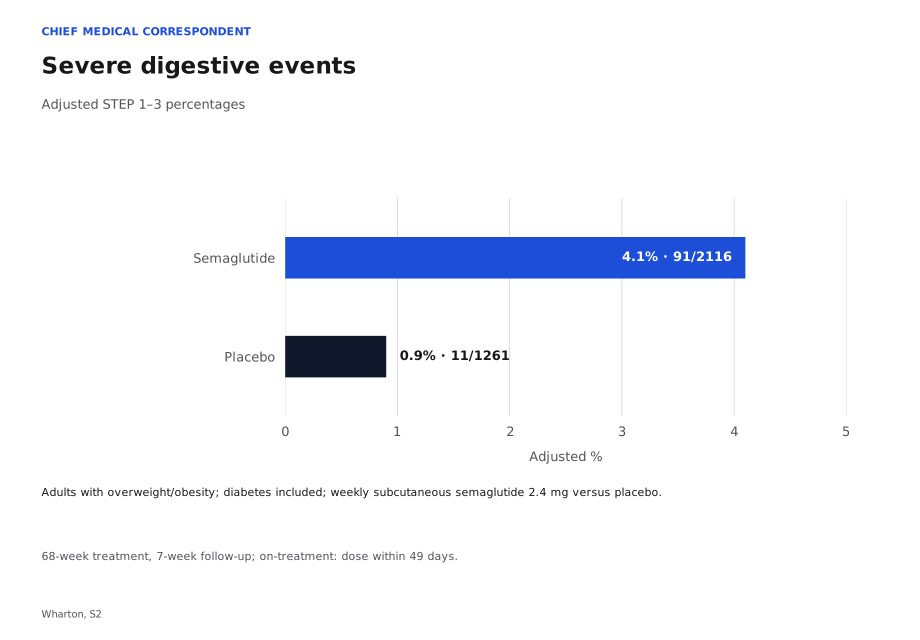
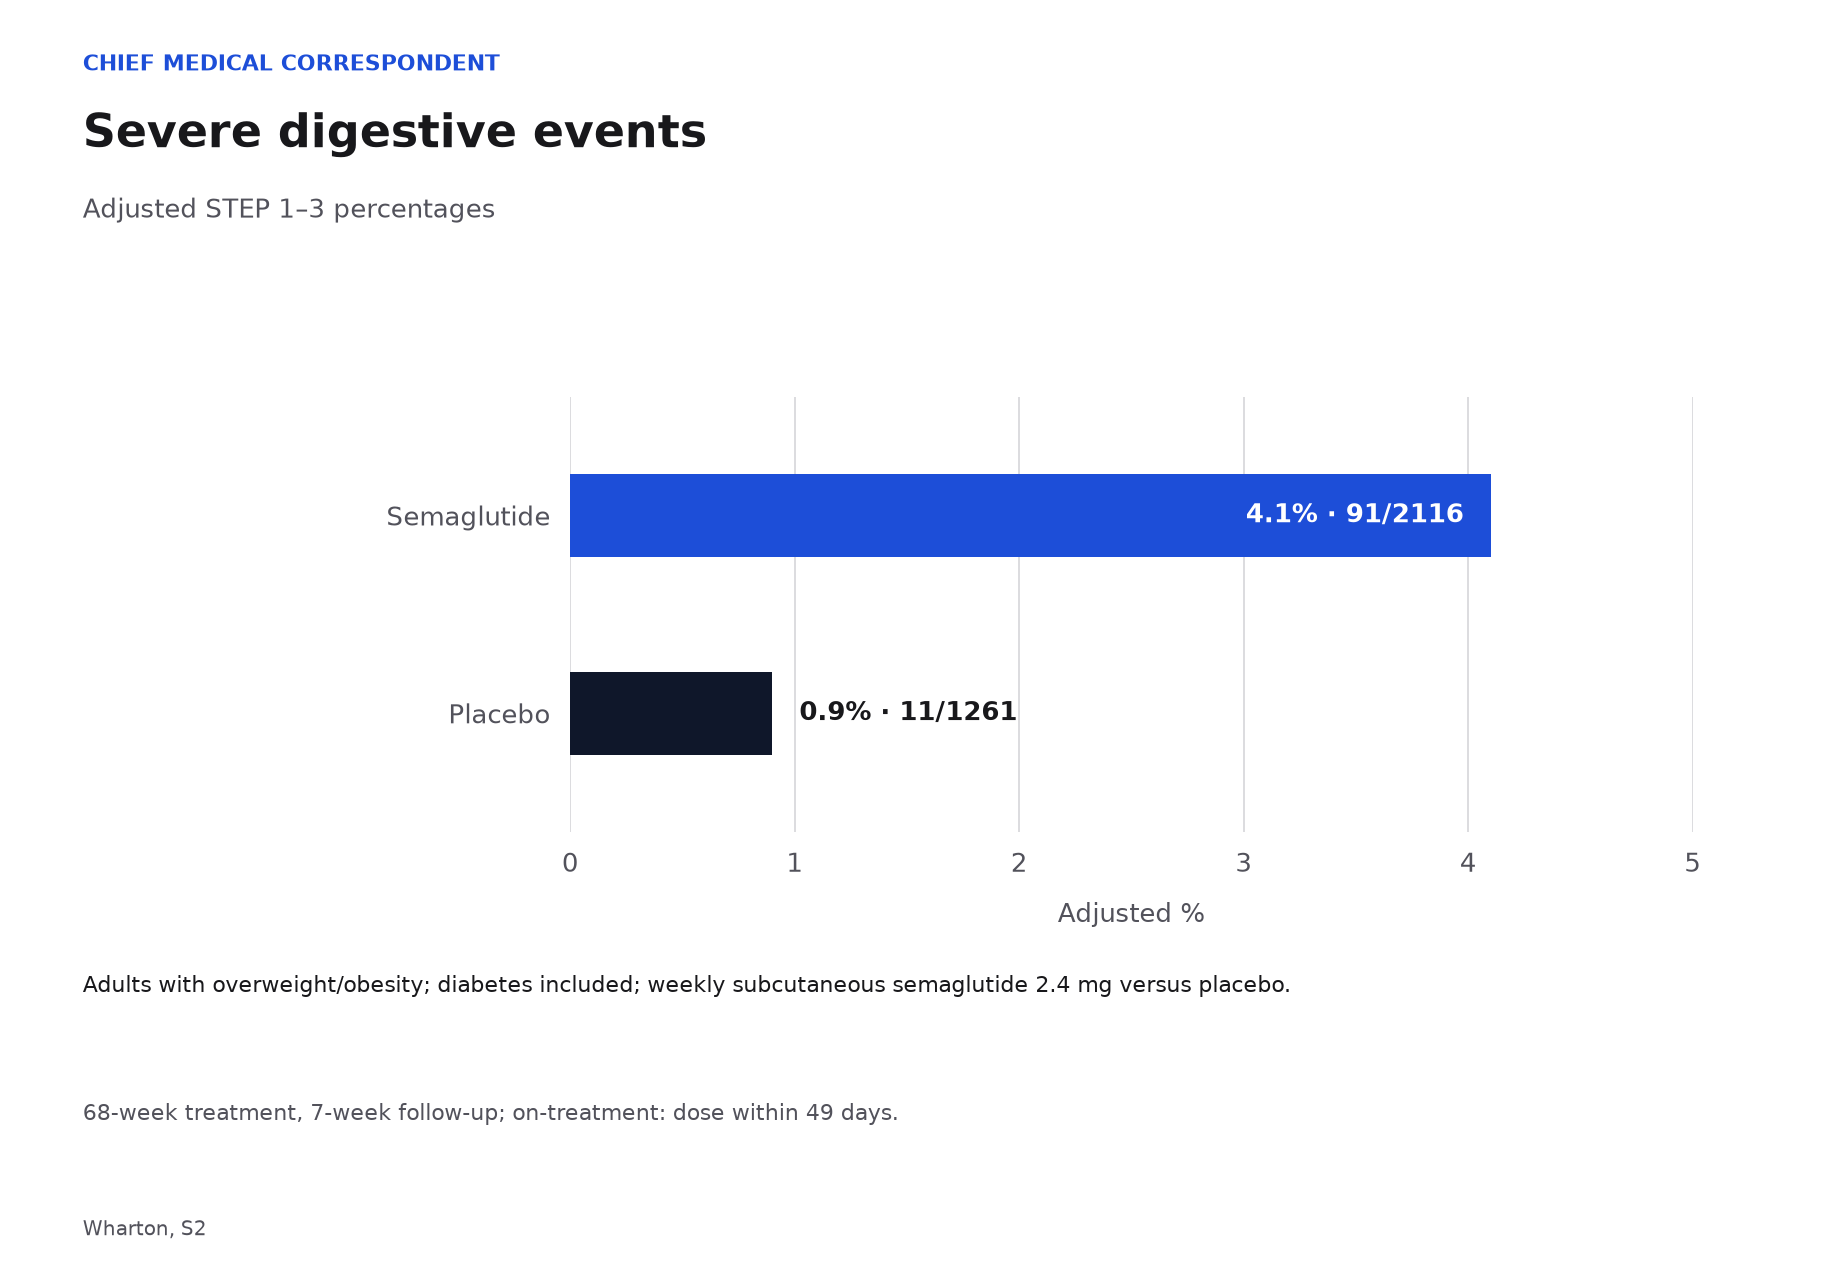
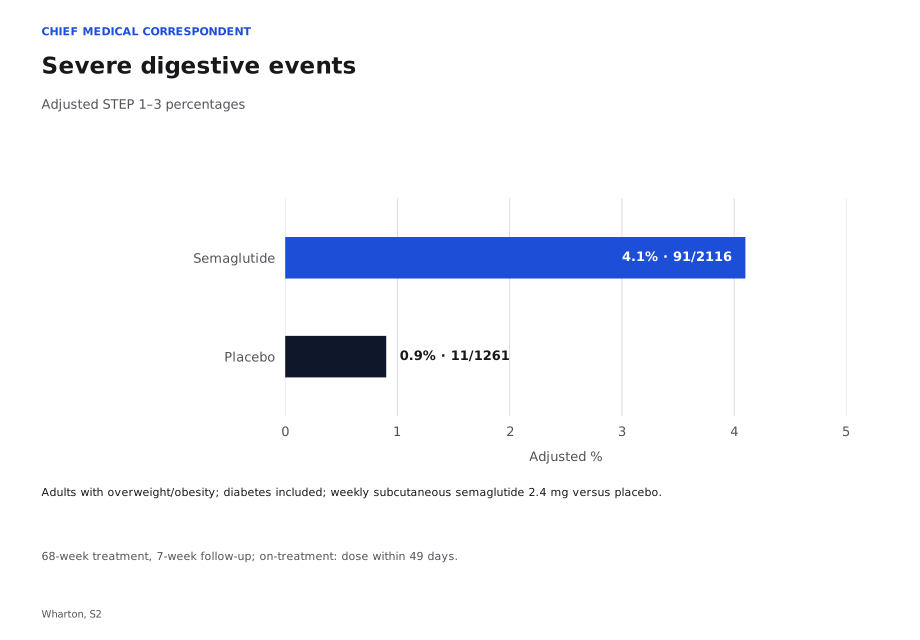
Severe digestive events
Adjusted STEP 1–3 percentages
Adults with overweight/obesity; diabetes included; weekly subcutaneous semaglutide 2.4 mg versus placebo.
68-week treatment, 7-week follow-up; on-treatment: dose within 49 days.
Sources: [1]
| Arm | n/N | Adjusted % |
|---|---|---|
| Semaglutide | 91/2116 | 4.1% |
| Placebo | 11/1261 | 0.9% |
A safety adjective is a measurement choice
Wharton pooled Novo Nordisk-funded trials post hoc; three authors were employee-shareholders. Severe meant preventing normal activities; seriousness used separate medical-outcome criteria.
The methodological question is what changes when an adjective becomes an endpoint. A category must have an entry rule: a recorded observation either qualifies or does not. Moving that threshold would change membership even if the underlying experiences remained identical. The category therefore expresses both what happened and the rule used to sort it. This is a measurement issue, not an accusation that the observations were arbitrary. A useful definition makes the sorting reproducible and tells readers which comparisons are meaningful.
Our interpretation starts by treating the category as an instrument with a particular purpose. Ask which feature it captures, which differences it deliberately compresses and whether the wording in a headline preserves that purpose. A category name alone cannot supply a complete account of burden. It can be informative within its defined scope while leaving other questions open. The concern is the scientific relationship between a definition and the conclusion attached to it.
For publication context, see our guide to reading medically reviewed health articles. It complements the measurement analysis developed here.
Sources: [1]
Read the classification before the percentage
Intensity, duration, recurrence and medical consequence describe different axes. There is no logical requirement that their rankings agree. Sorting records by one axis does not reveal the order they would take under another. A statement about membership in a category therefore cannot be translated into a statement about every other dimension simply by changing the adjective. Such a translation needs a measured relationship between the classifications.
A useful thought experiment is to hold the category total constant while rearranging the unreported duration and recurrence information. Many different patterns could remain compatible with that total. The point is not that any particular pattern occurred; it is that the aggregate alone cannot distinguish them. To investigate a relationship between classifications, a joint table would show which records meet each definition and which meet both. Separate totals leave that connection unresolved.
Measurement validity also depends on matching the classification to the question being asked. A researcher investigating disruption, persistence or medical consequences may need different observations and different endpoints.
For a separate practical topic, explore the digestive-symptom guide. Its purpose differs from interpreting the classification used in a research endpoint.
Sources: [1]
Why adjustment changes the arithmetic
A raw proportion gives each included person the contribution implied by the combined numerator and denominator. An adjusted summary introduces another operation: it combines information according to a specified rule. Trial-level contributions can therefore differ from the contributions created by simply putting all records into one large pile. The arithmetic answers a question about the chosen combination, not merely about the size of that pile.
To reproduce an estimator, an analyst needs the component counts, their analysis populations and the rule assigning their contributions. The target quantity matters too: what comparison is the adjustment intended to represent? A calculation that discards the rule may be mathematically correct for a different quantity while failing to reproduce the published estimate. An apparent mismatch is consequently a prompt to inspect the estimator before attributing it to missing records, calculation error or manipulation.
Precision is another separate issue. Knowing how a point estimate is constructed does not reveal its uncertainty. That requires information about variation and the estimation procedure. A chart without an uncertainty interval cannot supply one through visual spacing. The appropriate response is to identify the missing statistical information, rather than reverse-engineer confidence from the apparent distance between bars.
Sources: [1]
Separate the observation clock from the treatment clock
A study result can involve several clocks: assignment to an intervention, qualification of an observation and continued contact with a participant. These clocks need not begin or end together. Defining an analysis by exposure does not, by itself, tell a reader how later records are handled. An operational time rule is needed to determine which observations belong to the question.
Consider moving the analysis origin while leaving the underlying event histories unchanged. An event that previously appeared early could appear later relative to the new origin, or fall outside the newly defined window. No biological change is required for that change in classification. This is why a percentage tied to a specified observation window should not become a timeless property of a product. Comparing windows requires attention to both their boundaries and the people whose records contribute within them.
Turning a cumulative percentage into a rate per unit of time would ask a further question about exposure time and event occurrence. Simple division cannot establish a constant risk over time. To evaluate that assumption, the analysis would need dated records and an appropriate population at risk.
The guide to weight change after stopping treatment introduces a different temporal question. Read it alongside this distinction between observation clocks.
Sources: [1]
What an event flag keeps and what it loses
An event flag is a deliberately compressed record. Once it indicates that a qualifying event occurred, additional episodes may leave that flag unchanged. It therefore behaves differently from an episode count, a duration measure or a sequence of symptom states. This compression can make a participant-level comparison easier to summarize, but it also sets a boundary on what can be reconstructed from the summary.
A question about recurrence needs event histories. A question about persistence needs onset and end information, along with rules for uncertain dates. A question about recovery needs a definition of recovery and observations capable of establishing it. These information requirements follow from the questions themselves. They do not establish that a research team failed to collect the information, nor that an unreported experience was absent. Publication access and underlying data collection are separate matters.
The same distinction helps interpret an endpoint that records a decision or transition. Knowing that a transition occurred does not describe the path before or after it.
Our companion analysis of treatment and study discontinuation examines another endpoint question. Linking these analyses does not create a direct medicine comparison.
When a pooled result travels to another population
Pooling can be understood as a decision about whose experience contributes to a summary and how much each component contributes. Applying the summary elsewhere adds a transport question: why should the included mixture represent the population now being considered? That question remains even when the original comparison has a strong design. Internal comparability and external applicability are different properties.
Random allocation addresses the assignment process within the population enrolled. It does not automatically make that population a representative sample of everyone who might later receive care. Transporting a result requires identifying characteristics that could matter for the outcome or for the comparison. A characteristic associated with a different baseline frequency need not modify the treatment contrast, and a modifier need not be obvious from a pooled total. Both possibilities require examination rather than assumption.
A defensible extension would define the destination population, identify the relevant variables and examine whether the available information supports the proposed comparison there. The uncertainty should remain explicit when those conditions cannot be evaluated. A shared medicine name alone does not resolve the transfer question between preparations or care settings.
The guide to compounded-product rules offers separate product context. Keep that documentary question distinct from the assumptions required to transfer research evidence.
Sources: [1]
From a reported event to a causal claim
Temporal order is necessary for many causal questions, but it does not complete the answer. Observing an event after an exposure establishes a sequence. Attributing that event to the exposure asks what would have happened under a relevant alternative. The alternative must be specified, and the comparison must address other pathways that could influence the outcome. Otherwise, the causal claim remains broader than the observation supporting it.
A selected endpoint also cannot settle an overall benefit judgment on its own. Such a judgment needs the outcomes that matter for that decision, their measurement quality and a way to weigh competing consequences. Similarly, a biological explanation needs evidence connecting an intervention to intermediate processes and then to outcomes. A clinical category does not identify that chain merely because a mechanism sounds plausible.
The table maps proposed claims to the additional comparison each would require. These are original analytical questions, not findings attributed to the trial.
Explore the explanation of GLP-1 mechanisms for a separate biological discussion. Establishing a causal pathway remains its own research question.
| Proposed claim | Required comparison | Remaining uncertainty |
|---|---|---|
| An exposure caused an event | Comparable outcomes under defined alternatives | Other pathways and observation differences |
| One option has a better overall balance | Relevant benefits and harms measured together | How competing outcomes should be weighed |
| A mechanism explains a clinical category | Measurements connecting exposure, pathway and outcome | Whether the proposed pathway accounts for the observation |
| Evidence transfers to a new preparation | A justified comparison of the preparations and their use | Which differences could change the result |
Sources: [1]
Reconstruct the evidence behind a headline
Reconstructing a headline means identifying the chain between a record and a conclusion. Begin with the endpoint definition, then identify the records eligible to contribute and the operation used to summarize them. Each step has a different role. A definition specifies meaning, eligibility specifies the analyzed population, and an estimator specifies the mathematical question. Losing any step can change what the final statement appears to establish.
A source table can be internally coherent while remaining insufficient for a newly proposed interpretation. Asking for another variable or a joint distribution is not the same as finding an error in the existing table. The table below separates what a recorded item supports from the information needed to go further. This makes criticism testable: a reader can name the missing bridge rather than express a general lack of confidence.
The wording of a conclusion should preserve those bridges. If it moves from a category to a mechanism, or from an analyzed population to a different audience, the new step needs its own support. The transferable skill is identifying the scientific claim being made, while preserving the identity of the outcome.
Our guide to cardiovascular research headlines offers another reading context. The analytical skill is identifying the claim, while keeping different outcomes distinct.
| Recorded item | Question it supports | Information needed to extend it |
|---|---|---|
| A qualifying-event indicator | Whether a record meets the chosen definition | Episode history for recurrence or duration |
| A category total | How many records enter that category | Joint classification to identify overlap |
| A combined estimate | The summary under its contribution rule | Component data and weights to reproduce it |
| An observation window | Which timed records qualify | A new temporal model for a rate or trajectory |
Sources: [1]
Bring current prescribing information into view
The current Wegovy label rules out use with a personal or family history of medullary thyroid carcinoma, MEN2, or previous serious allergy to semaglutide or its ingredients. Its thyroid warning arises from rodent tumors; human relevance is unknown. Warnings include pancreatitis, gallbladder problems, severe digestive reactions and kidney injury following dehydration. Severe gastroparesis is a reason use is not recommended. Severe or persistent abdominal pain needs prompt clinical assessment. Report ongoing digestive symptoms and tell an anesthesia team about treatment.
An individual decision requires information about the person and the present clinical situation. A group summary cannot perform that assessment. In particular, the position of a bar does not supply a threshold for waiting, a diagnosis for a symptom or a reason to alter a prescription independently. Keeping this distinction visible allows the research analysis to remain useful without turning its measurement rules into instructions for care.
The gastroparesis guide provides separate educational context. Reading about a diagnostic category does not establish that it explains an individual symptom.
Sources: [3]
Which additional evidence would change the account
Additional evidence is most useful when it answers a specified unresolved question. A joint endpoint table could address how classifications overlap. Exposure-aligned longitudinal records could show how events, treatment status and follow-up relate over time. A predefined comparison in a target population could examine applicability. These are distinct extensions; collecting more information without identifying the target question does not guarantee a more informative conclusion.
The next analysis would also need a plan for incomplete observation. If the chance of being observed depends on something related to the outcome, complete records may not describe the same population as all eligible records. That is a possibility to investigate, not a conclusion about this study. Sensitivity analysis would ask how the answer changes under explicit assumptions about the information not observed. Its value lies in exposing dependence on assumptions, rather than manufacturing certainty.
Finally, a useful report should connect its analysis choices to the question it claims to answer. Readers should be able to distinguish the empirical result, the interpretation placed on it and the evidence needed to extend that interpretation. A more detailed account earns its value by making those connections inspectable, not by accumulating additional adjectives around the original percentage.
Sources: [1]
Questions about the evidence
Does an adjective identify the whole burden of an event?
No single classification necessarily captures every dimension. A threshold can organize records along one axis while leaving duration, recurrence or other consequences unresolved. To infer a broader burden, the analysis would need measurements of those dimensions and a stated way of combining them. Changing the adjective in a headline does not provide that missing information.
Sources: [1]
Why might a count and an adjusted percentage seem inconsistent?
They can describe different mathematical summaries. Combining raw records gives contributions determined by the combined totals; adjustment applies a specified contribution rule. Reproducing an adjusted estimate requires the component information and the rule. The first check is whether the calculation targets the same quantity, before treating a discrepancy as evidence of an error.
Sources: [1]
Can a percentage be converted directly into a weekly risk?
A percentage tied to an observation window does not by itself describe how risk is distributed within that window. A time-based analysis needs dated observations, an appropriate population at risk and a model suited to the question. Dividing by elapsed time alone would silently add assumptions about the process generating events.
Sources: [1]
Does an aggregate tell us who experienced overlapping outcomes?
A total describes membership in one category without identifying the joint membership of another. Connecting outcomes requires a cross-tabulation or linked individual records, and chronology requires timing information as well. The absence of that information in an aggregate should remain an information limit, rather than becoming a claim that overlap did or did not occur.
Sources: [1]
What makes a result relevant to a different audience?
The destination population and the proposed comparison must be defined. Then an analyst can examine whether relevant differences are measured and whether the evidence supports the assumptions needed for transfer. Similar terminology or a shared treatment name is not enough. Applicability is a reasoned extension that should remain distinguishable from the original estimate.
Sources: [1]
Editorial assessment
The strongest interpretation of a safety headline keeps the measurement rule attached to the result. A classification identifies a dimension; an estimator defines a summary; an observation rule determines which records contribute. Moving beyond that combination requires a specific evidentiary bridge. Joint classifications would address overlap, longitudinal records would address trajectories, and a defined comparison in another population would address transfer. Treating those extensions separately makes the scientific account more useful: it shows exactly which conclusion is supported, which assumption would be added and what further investigation could resolve the uncertainty. A headline becomes more informative when its claim is precise, rather than when its language sounds more decisive.
Sources and access
- Wharton (2022): semaglutide tolerability
Article and supplement checked.
Checked .
- Rubino (2025): tirzepatide tolerability
Article and supplement checked.
Checked .
- DailyMed: Wegovy prescribing information
Current official label checked.
Checked .
- DailyMed: Zepbound prescribing information
Current official label checked.
Checked .